Protoplanetary Cloud Data Visualizer
June 2025
GitLab · Internship Report
A 3D data visualizer for protoplanetary cloud simulations. Done in 6 weeks in the context of an internship at the Côte d'Azur Observatory. The tool lets you import and slice 3D data, visualize velocities, and even includes a ray marched cloud view for realistic real-time rendering.
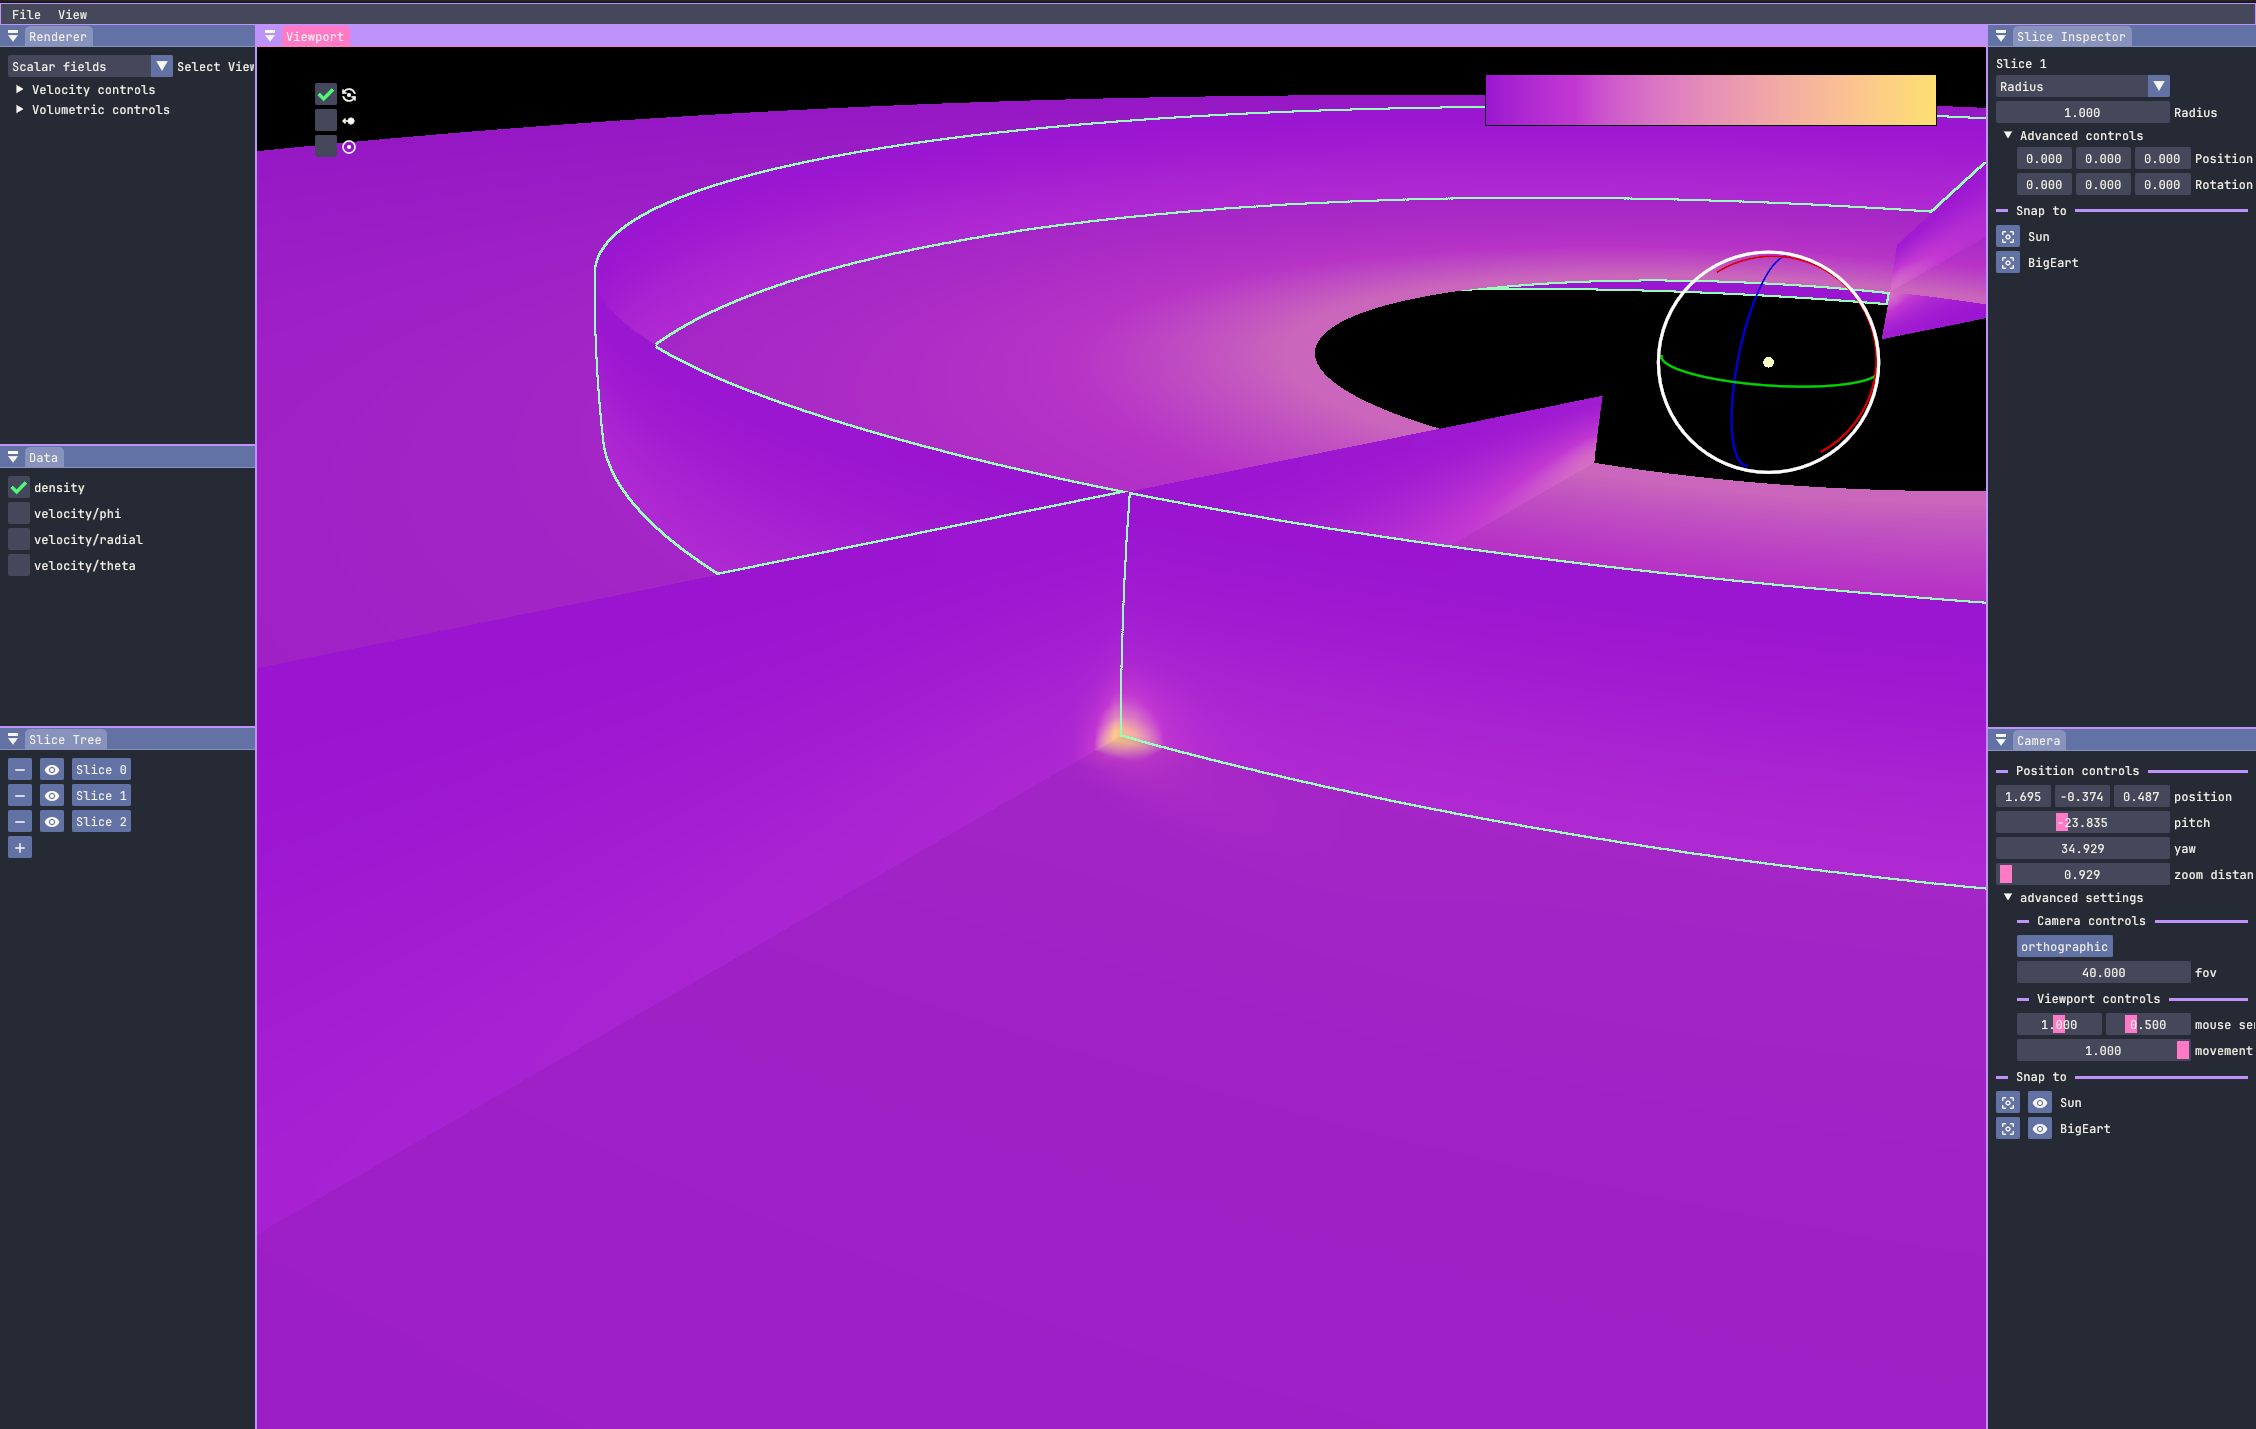
Simple slice
Velocity clouds
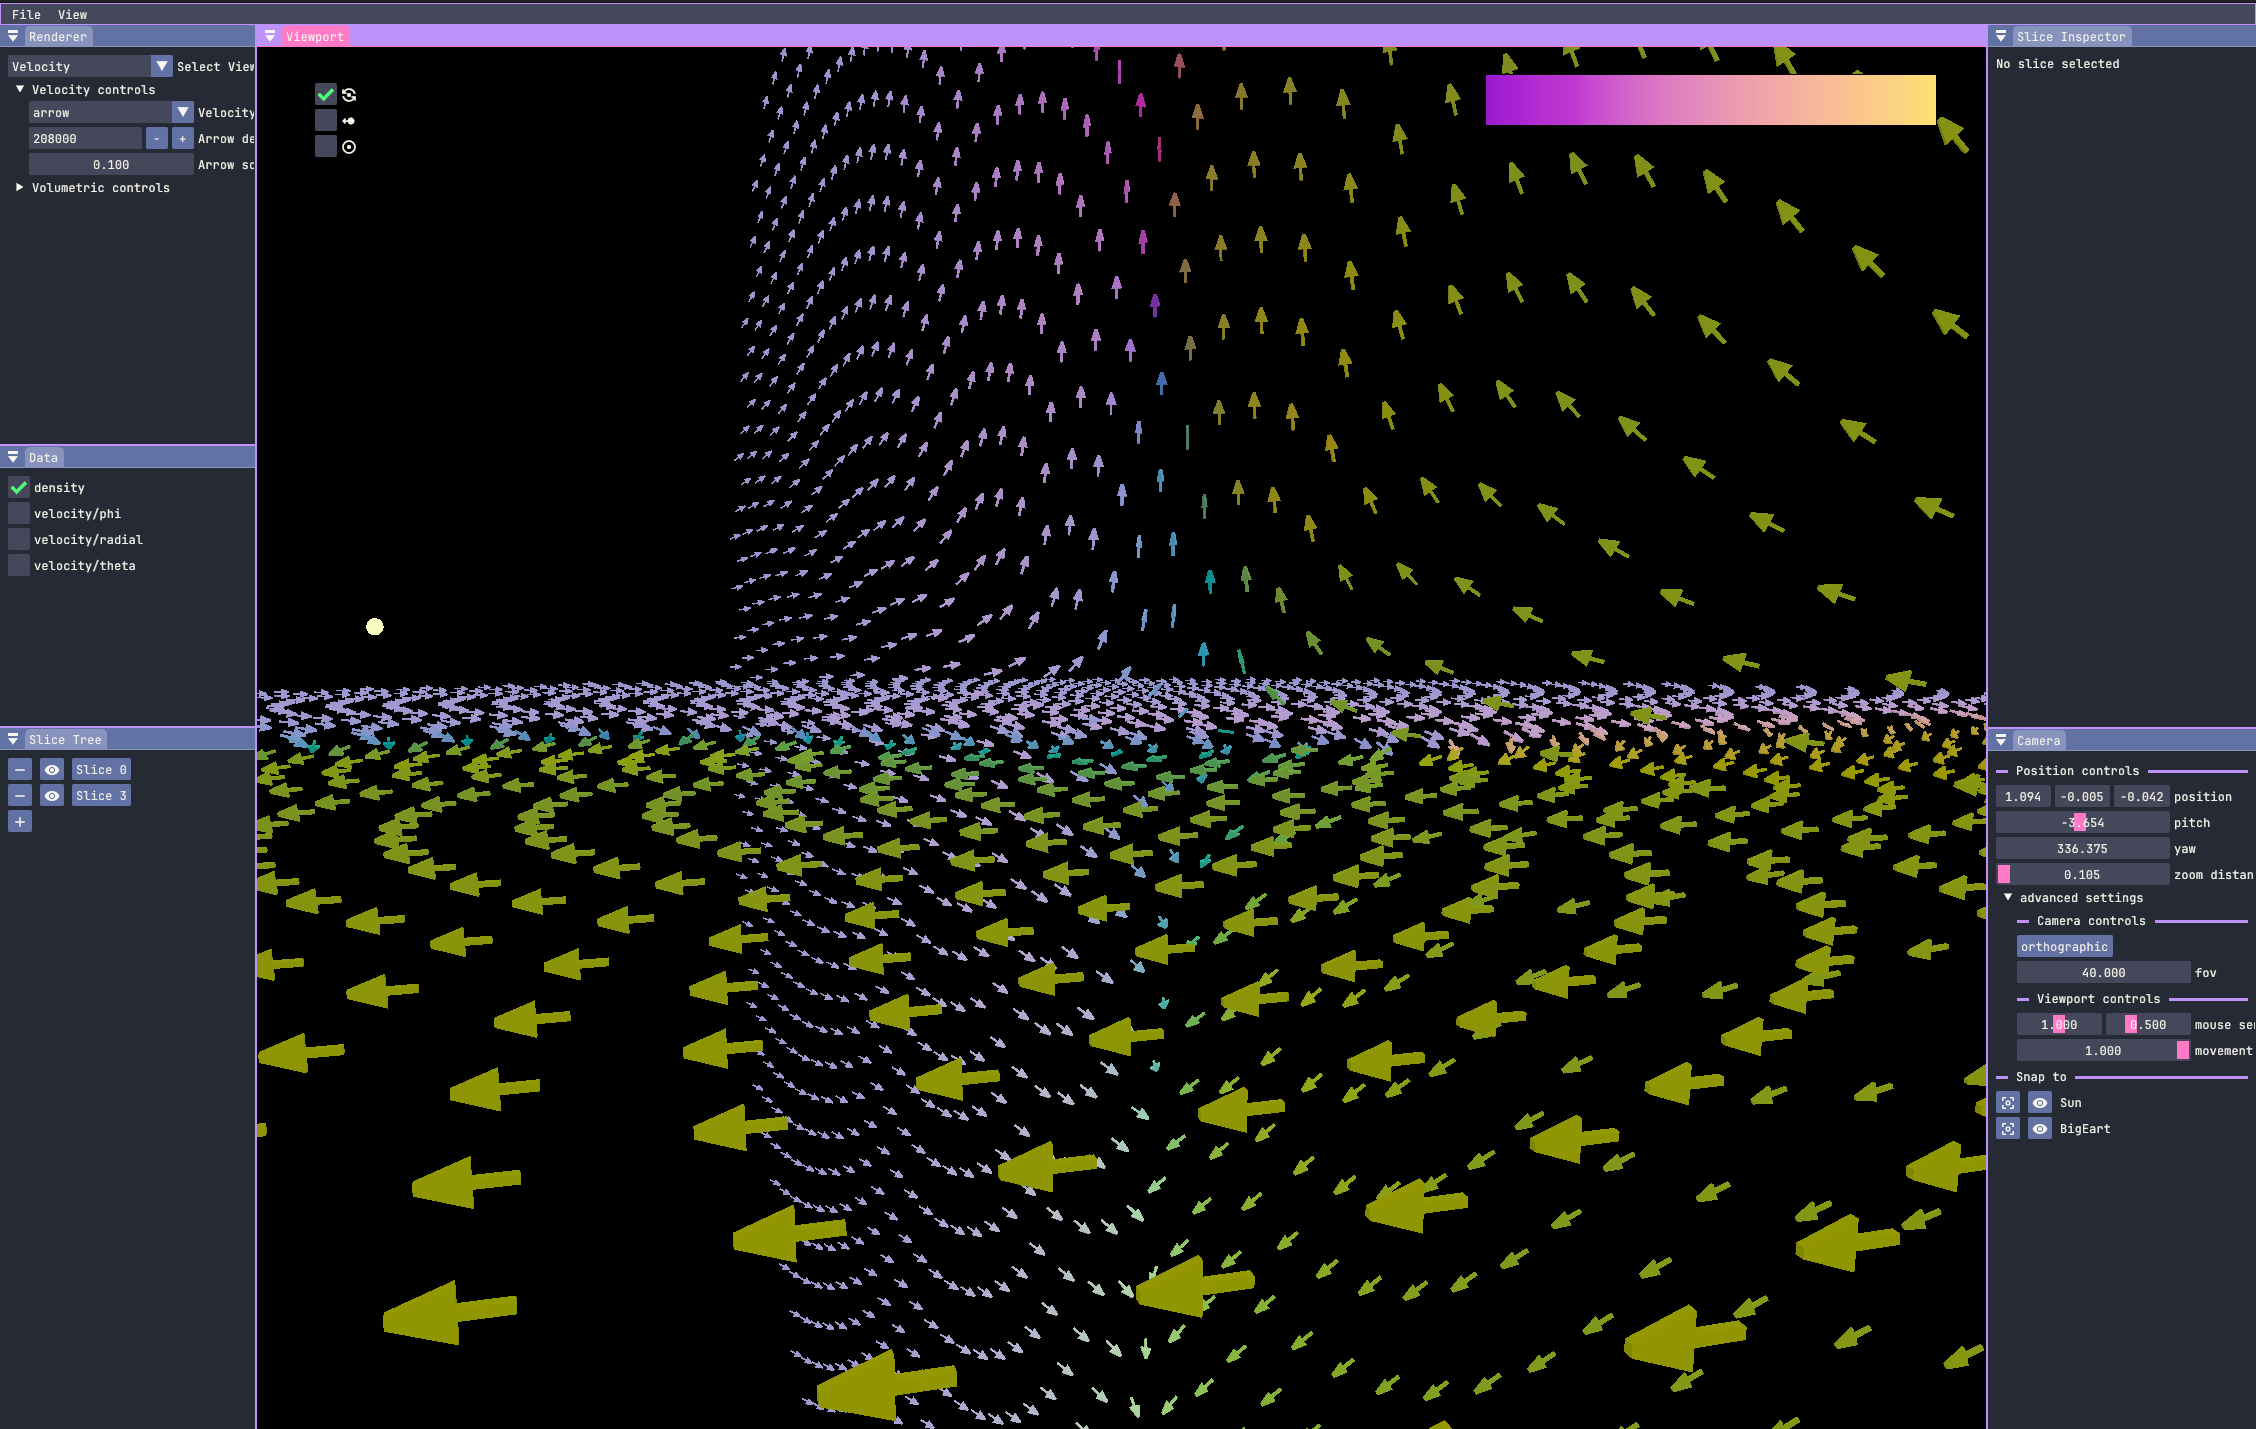
Data visualization
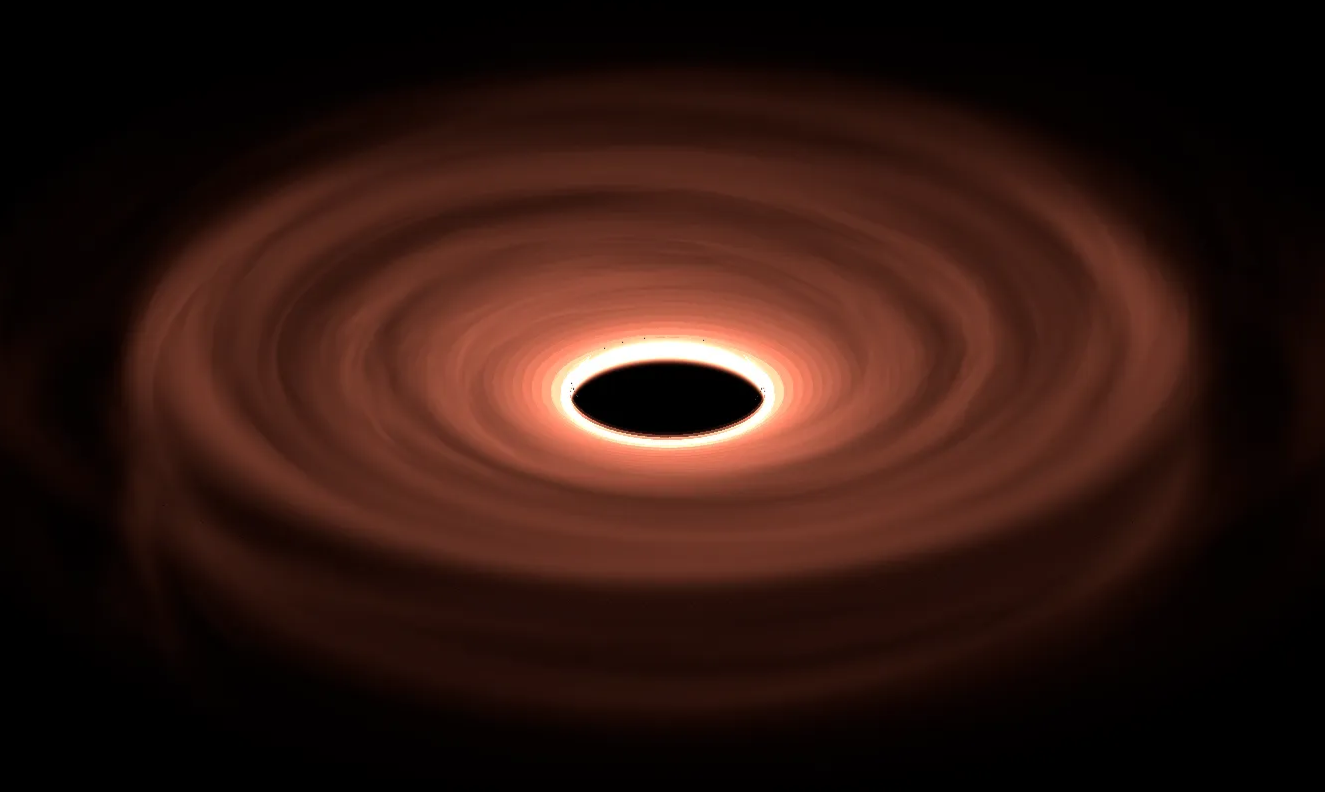
Ray-marching
Ray-marching is a rendering technique which simulates light bouncing in a volume. Here, it means physically accurate renderings of otherwise hard to observe astronomical objects, which was very exciting.
This was a technique previously implemented in OpenGL, so the shaders only had to be copied over. Having written a render-graph for this project, integrating new rendering pipelines became straight-forward. The full implementation only took a day.

Context
The team worked on protoplanetary clouds and developed a tool called fargOCA that allows them to run simulations on various supercomputers. Researchers previously analyzed data in Python by slicing it using various plotting libraries. This process was tedious and could miss key information. The tool addresses the issue by letting researchers slice the data directly in 3D, in real time, however they see fit.
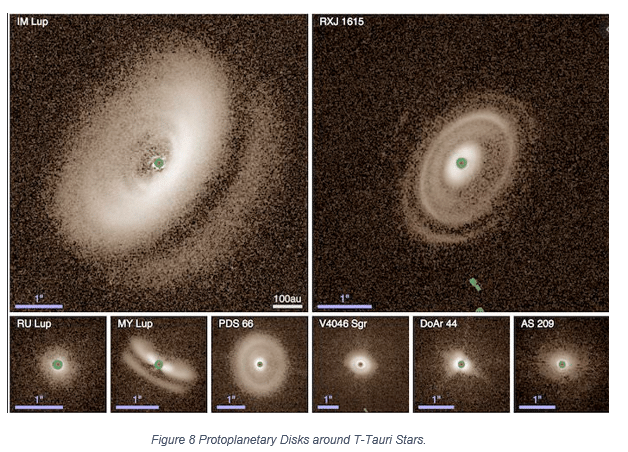
Protoplanetary clouds are the rotating disks of dust and gas that surround young stars. Over millions of years, this material coalesces into planets and other bodies. These systems raise key questions: why do some planets settle into stable orbits? Why do some systems form gas giants while others don't?